Interactive display#
The Calzone interactive display enables users to navigate through the Monte Carlo geometry by controlling a drone-like camera. Furthermore, Monte Carlo tracks can be superimposed for a visual inspection.
Important
The interactive display has a limited numeric accuracy of 32 bits. While this
approach provides a convenient overview of the geometry, for a robust
detection of overlapping volumes, the Geometry.check method should be used instead.
Note
The interactive display is a standalone instance running in parallel with Python’s main thread. However, there can only be one display instance per process. This means that launching a new display will overwrite any existing one (in the same process).
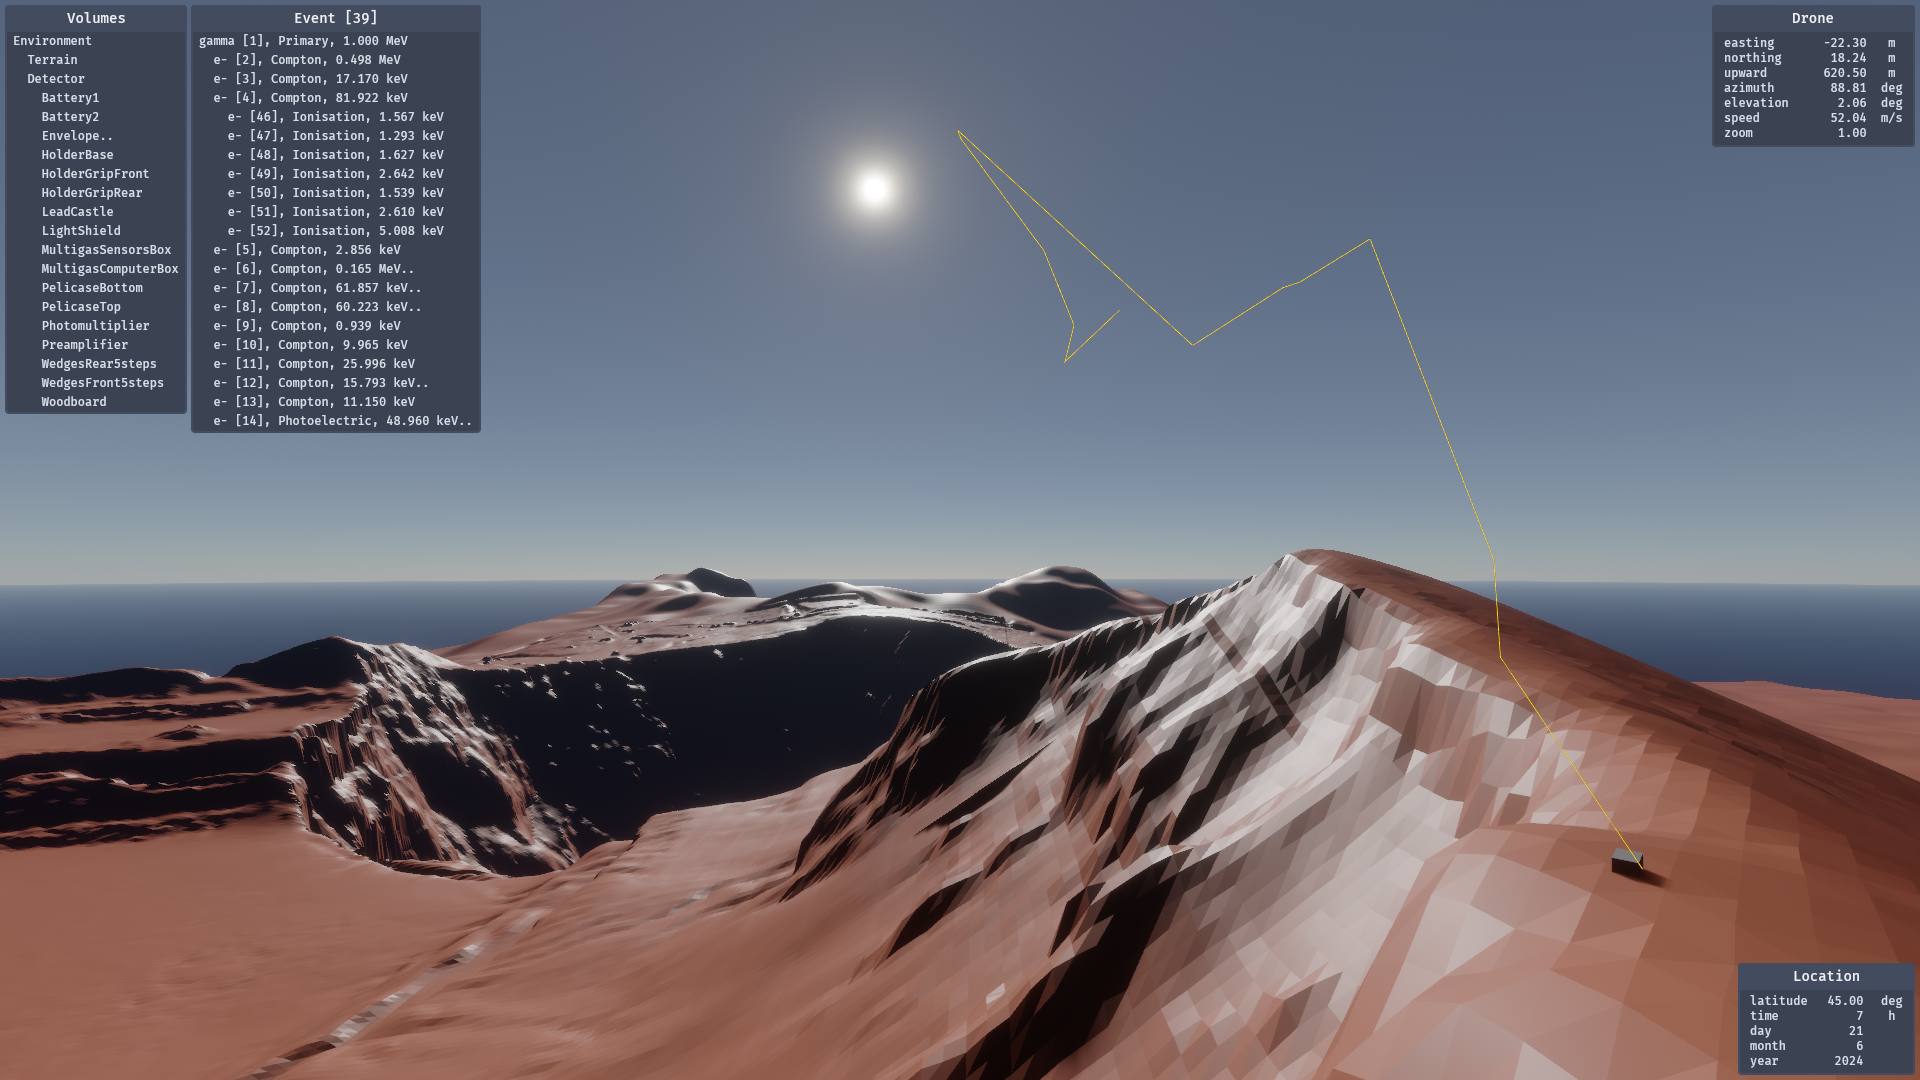
Fig. 6 Example of geometry and tracks, as visualised with the Calzone interactive display. The Volumes and Tracks menus are visible on the upper left corner. The Drone camera statistics are indicated on the upper right panel. Sunlight Lighting is used with atmospheric scattering enabled. The corresponding Location settings are indicated on the lower right panel. The geometry is rendered in Plain Display mode.#
The Drone#
The Drone is the entity responsible for controlling the display camera. It can be moved around using the WASD keys (assuming a QWERTY layout), and rotated by holding down the right mouse button. The available actions are summarised in Table 28 below. Furthermore, the Drone statistics (position, speed, etc.) are indicated at the top right of the display window.
Action |
Result |
|---|---|
|
Rotate the Drone. |
|
Move the Drone to the left. |
|
Move the Drone downwards. |
|
Move the Drone to the right. |
|
Increase the Drone speed. |
|
Decrease the Drone speed. |
|
Move the Drone backwards. |
|
Move the Drone upwards. |
|
Move the Drone forwards. |
Lighting modes#
By default, the drone camera uses a bright overhead light to illuminate the
scene. As an alternative option, sunlight illumination, with or without
atmospheric scattering, can be utilised. Pressing the p key enables the
user to cycle through the lighting modes.
Activation of the sunlight lighting function will open a Location panel in the bottom right corner of the display window. The lighting parameters (latitude, time, etc.) are reported on this panel. To edit these settings, simply click on the corresponding value. For an overview of the available interactions, refer to Table 29 below.
Action |
Result |
|---|---|
|
Enter (if on a location setting value) or Exit (otherwise) the edit mode. |
|
Toggle the lighting mode. |
|
Exit the edit mode (if in edit mode). |
Display modes#
By default, plain solids are rendered as opaque. While this is a realistic
rendering, it may not be convenient in some circumstances. Therefore,
alternatively, solids can also be rendered as transparent (using Blending or
Premultiplication). Additionally, the solid-mesh wires can be displayed for gas
volumes only (which are invisible otherwise), or for all volumes. These display
options can be selected using the PageDown, PageUp and
Shift keys, as detailed in Table 30 below.
Action |
Result |
|---|---|
|
Switch to the previous display mode. |
|
Switch to the previous wireframe mode. |
|
Switch to the next display mode. |
|
Switch to the next wireframe mode. |
|
Decrease the transparency (in Blend or Premultiplied mode). |
|
Increase the transparency (in Blend or Premultiplied mode). |